

2-Chloroethanol Induced Upregulation of Matrix Metalloproteinase-2 in Primary Cultured Rat Astrocytes Via MAPK Signal Pathways
Time:2021/8/2 14:31:38
This study was to explore the mechanisms underlying 1,2-dichloroethane (1,2-DCE) induced brain edema by focusing on alteration of matrix metalloproteinase-2 (MMP-2) in rat astrocytes induced by 2-chloroethanol (2-CE), an intermediate metabolite of 1,2-DCE in vivo. Protein and mRNA levels of MMP-2, and the phosphorylated protein levels of p38 MAPK.
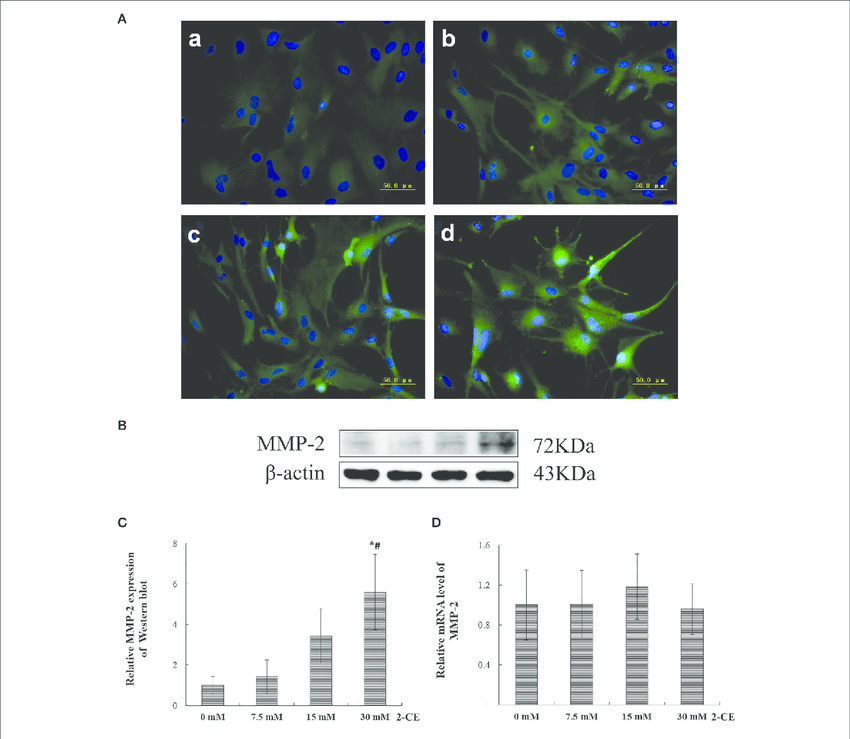
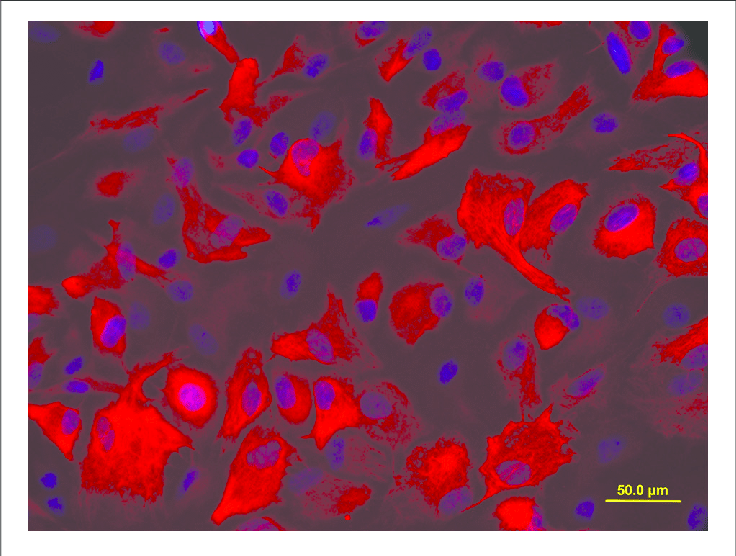
Changes of MMP-2 protein and mRNA levels in primary cultured astrocytes exposed to 2-CE. (A) Immunofluorescence staining for MMP-2 (400×). a: control; b: 7.5 mM dose; c: 15 mM dose; d: 30 mM dose 2-CE. (B) Western blot analysis. Images were the representative results of three separate experiments for each group. (C) Densitometric analysis of western blots for MMP-2. The relative intensity in arbitrary units compared to β-actin and presented as fold change vs the control group. (D) Quantitation of MMP-2 mRNA by real-time RT-PCR. The gene expression was normalized to GAPDH and presented as fold change vs. the control group. Data expressed as mean ± SD were the results of three independent experiments from different litters of rats for each treatment, and analyzed byOne-way ANOVA. Significant difference was defined as p < 0.05, and * , vs. control; # , vs. 7.5 mM dose.
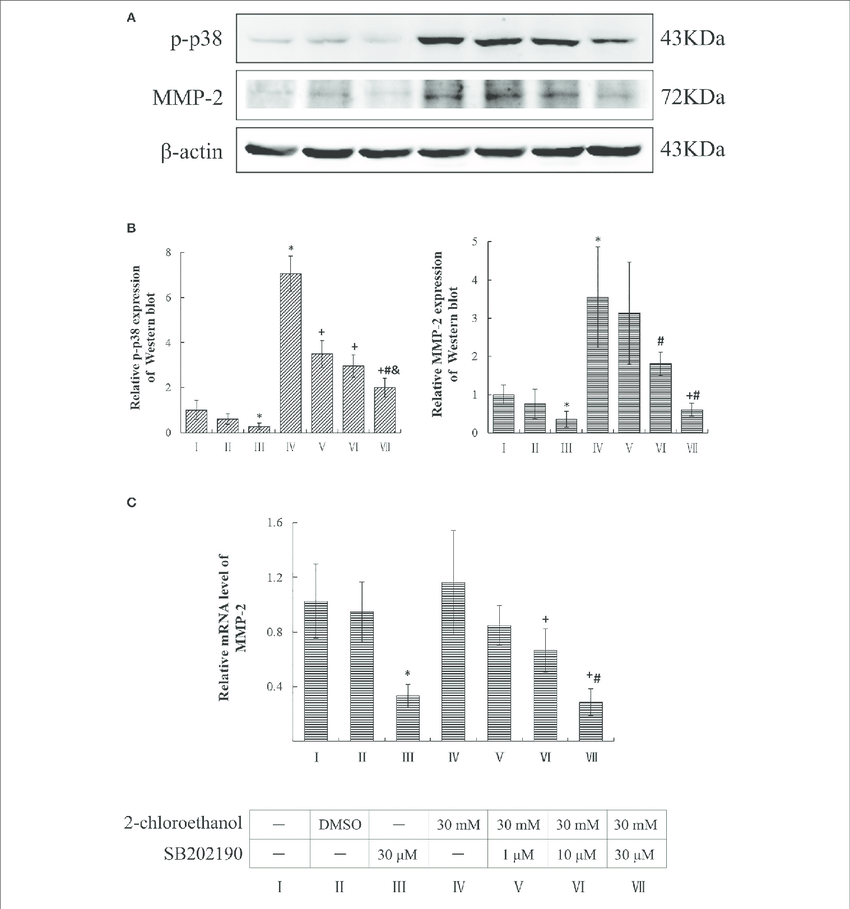
Involvement of p38 in MMP-2 induction in primary cultured astrocytes exposed to 2-CE. I to VII represent the blank control, solvent control, inhibitor control, exposure group, and low, middle and high dose of SB202190 inhibition group, respectively. (A) Western blot analysis. Images were the representative results of three separate experiments for each group. (B) Densitometric analysis of western blots. The relative intensity in arbitrary units was compared to β-actin and presented as fold change vs. the control group. (C) Quantitation of mRNA by real-time RT-PCR. The gene expression was normalized to GAPDH and presented as fold change vs. the control. Data expressed as mean ± SD were the results of three independent experiments from different litters of rats for each treatment, and analyzed by One-way ANOVA. Significant difference was defined as p < 0.05, and * , vs. blank control; + , vs. exposure group; # , vs. low dose intervention group; & , vs. middle dose intervention group.
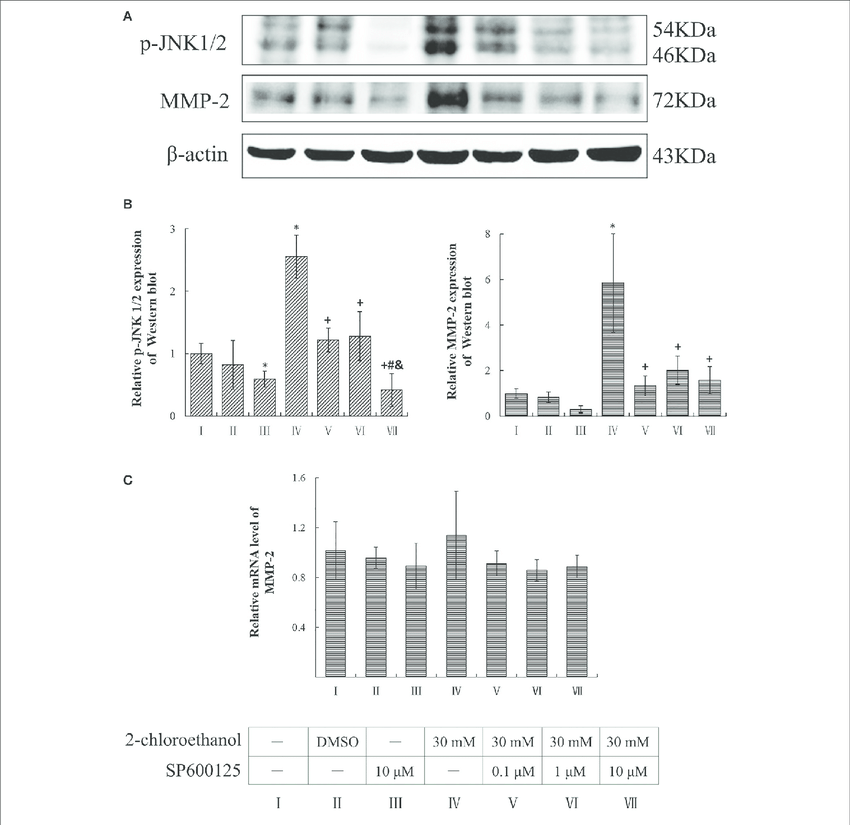
Involvement of JNK in MMP-2 induction in primary cultured astrocytes exposed to 2-CE. I to VII represent the blank control, solvent control, inhibitor control, exposure group, and low, middle and high dose of SP600125 inhibition group, respectively. (A) Western blot analysis. Images were the representative results of three separate experiments for each group. (B) Densitometric analysis of western blots. The relative intensity in arbitrary units was compared to β-actin and presented as fold change vs. the control group. (C) Quantitation of mRNA by real-time RT-PCR. The gene expression was normalized to GAPDH and presented as fold change vs. the control. Data expressed as mean ± SD were the results of three independent experiments from different litters of rats for each treatment, and analyzed by One-way ANOVA. Significant difference was defined as p < 0.05, and * , vs. blank control; + , vs. exposure group; # , vs. low dose intervention group; & , vs. middle dose intervention group.
 < /a>
< /a>